Genealogy and Your DNA
09 December 2018
History Branch & Archives
833 N. Ocoee
Cleveland, TN 37311
Link to other presentations HERE
Slide 01
This presentation is the second in a series of presentations that I have been asked to give for the Cleveland TN, Historical Library. I’d like to thank Margot Still for allowing me to do these. DNA is a complex topic and I hope that with this presentation and the ones I will do in the following months that I help you understand the basics of how it works.
Slide 02
So what is this presentation all about? The focus is to explain how DNA works and how can we use DNA comparisons to aid in family tree research.
My professional background is 26+ years of computer training, course development, consulting, and I have a few published computer technology related books that I have worked on. I have taught over 350 different classes in my career. I primarily now teach companies on how to build a cloud and use virtualization to extend their data center capabilities.
I have 45+ years of genealogy experience with the past 33 years using computer software to aid in my research. I have been on Ancestry.com since 2007.
Slide 03
As covered in the first presentation – we first start our genealogical research by recording information about our closest relatives. We use records that are considered Primary Sources to provide the “skeleton” of our family tree. To learn more about Primary sources click HERE.
Slide 04
If it were only this simple!
Slide 05
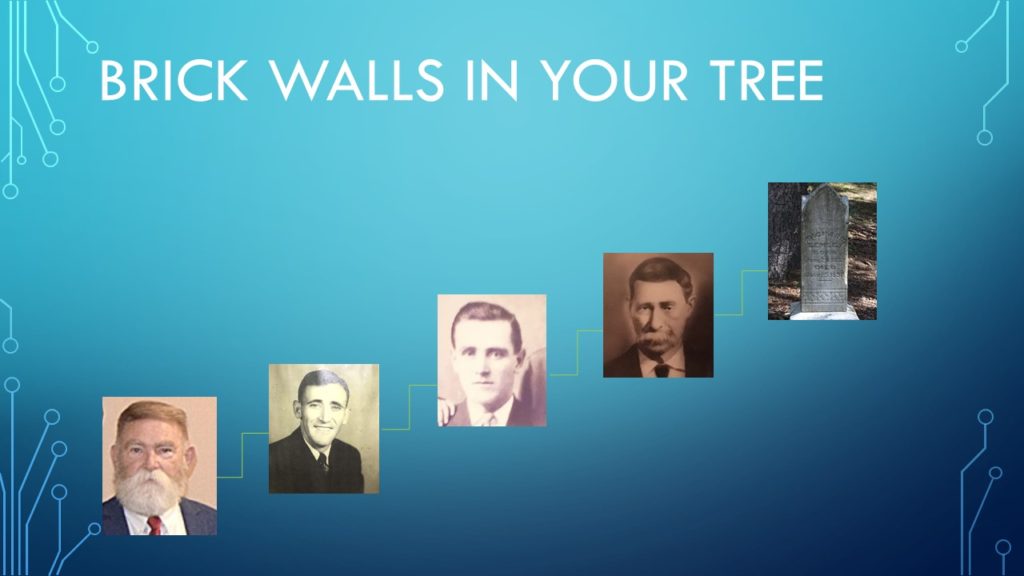
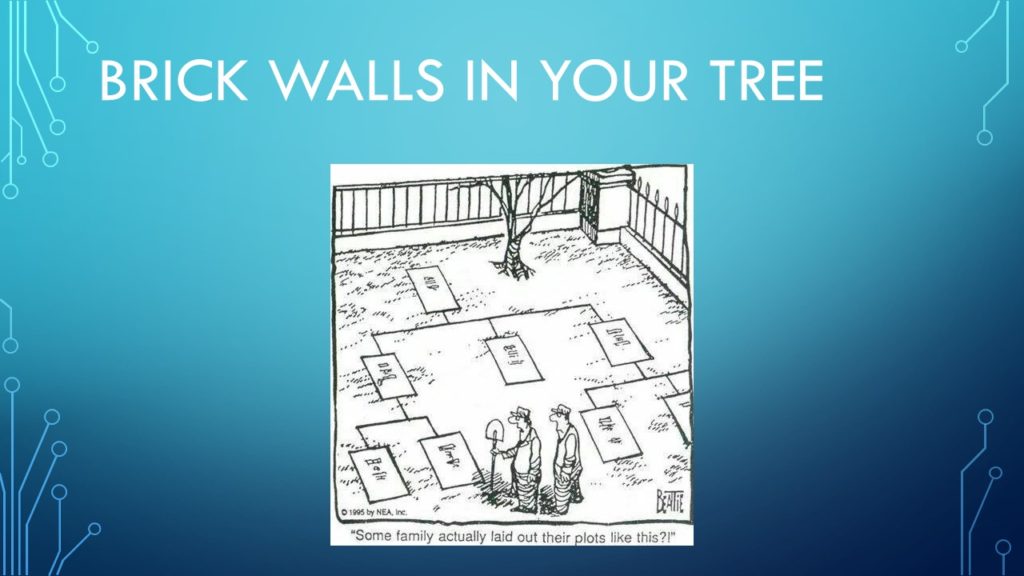
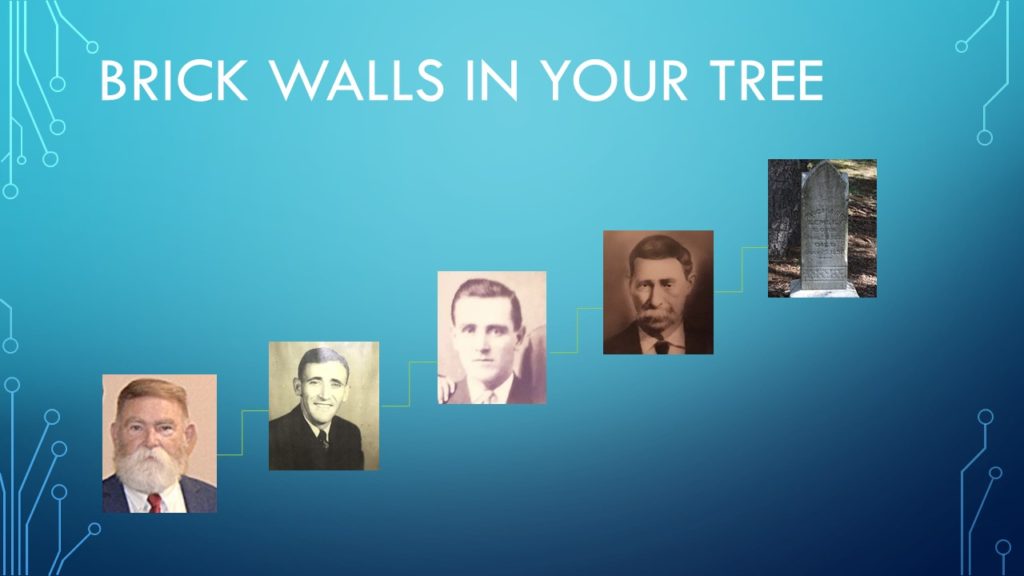
When you work on your tree you will discover “Brick Walls” in your tree. These “brick walls” are people that you might not be able to find on any Primary records to confirm their relationship to other people in your tree. This can be the result of:
- You haven’t found the document that proves the relationship.
- There are no surviving documents.
- This person really isn’t related as you think they are.
- The person is illegitimate so records won’t prove their real relationships.
Slide 06
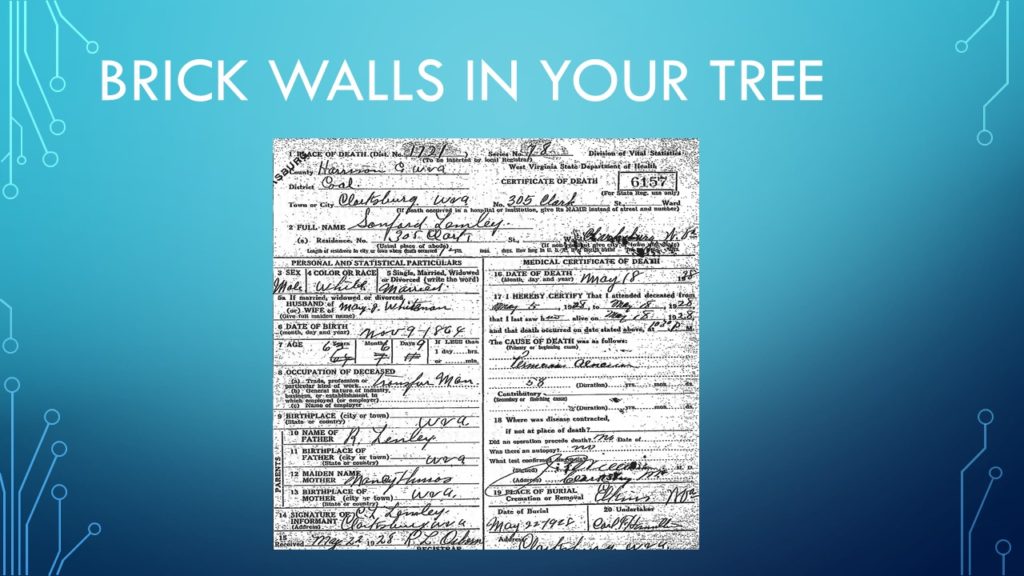
Another issue is when public documents contain errors.
Slide 07
Genetic genealogy is the use of comparing your DNA results to someone else’s results to determine the genetic relationship between you and them. We will see that if you have no common DNA it doesn’t necessarily mean you are not related. But common DNA does mean that you have a genetic relationship with that individual.
Slide 08
DeoxyriboNucleic Acid, a self-replicating material which is present in nearly all living organisms as the main constituent of chromosomes. It is the carrier of genetic information.
Slide 09
DNA is a complex topic. For the purpose of this presentation I will focus on the basics.
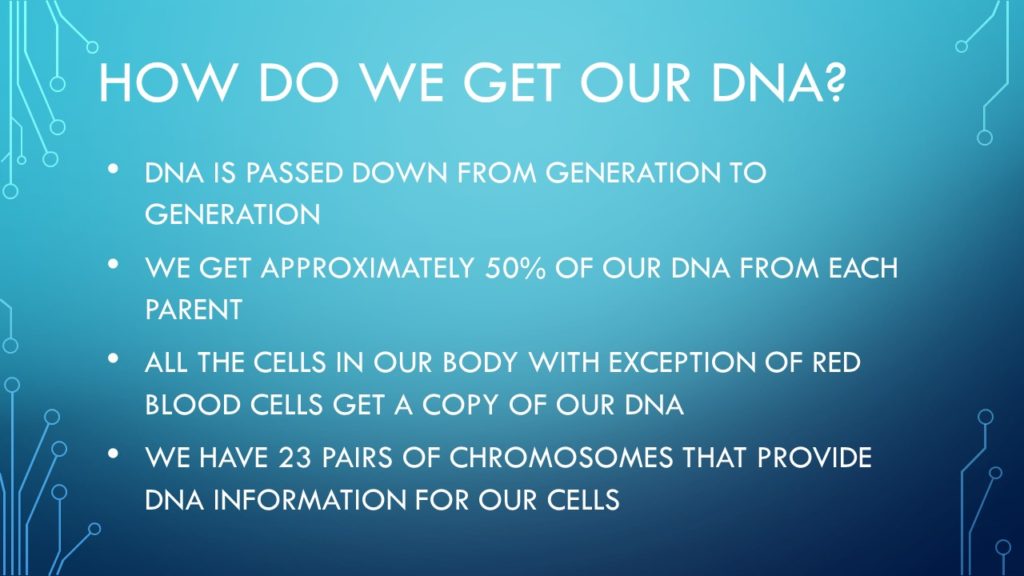
We get our DNA from our parents who got it from their parents and so on. Autosomal DNA [which is the focus of this presentation] comes only from the first 22 Chromosomes from each parent.
Slide 10
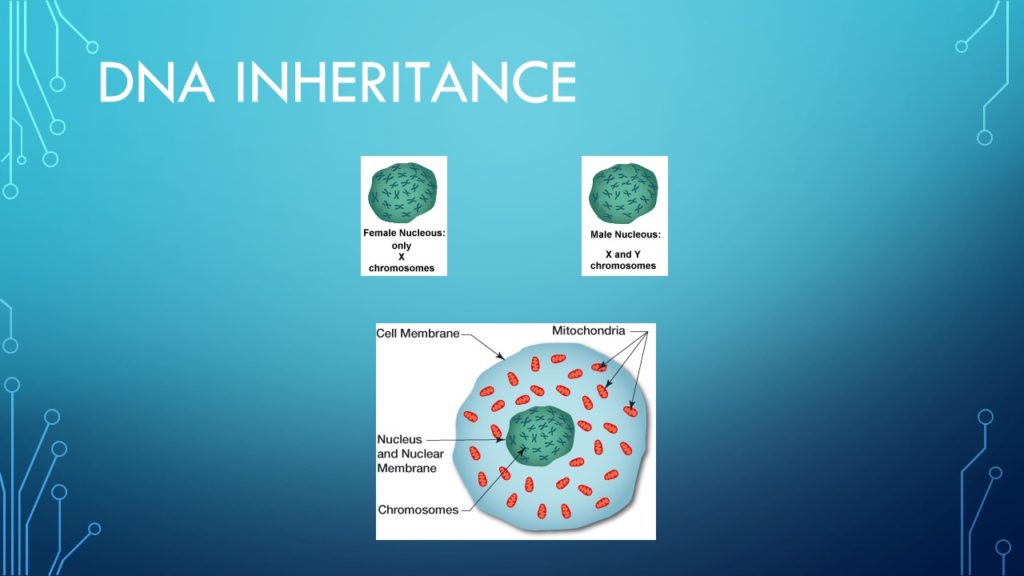
Chromosome 23 determines sex. Mitochondrial DNA (also known as mtDNA or mDNA) is the DNA located in mitochondria.
There are over 35 different types of DNA tests. Most people start with the autosomal test and later with other tests that test the x, y and mtDNA. I will cover those tests in later presentations.
Slide 11
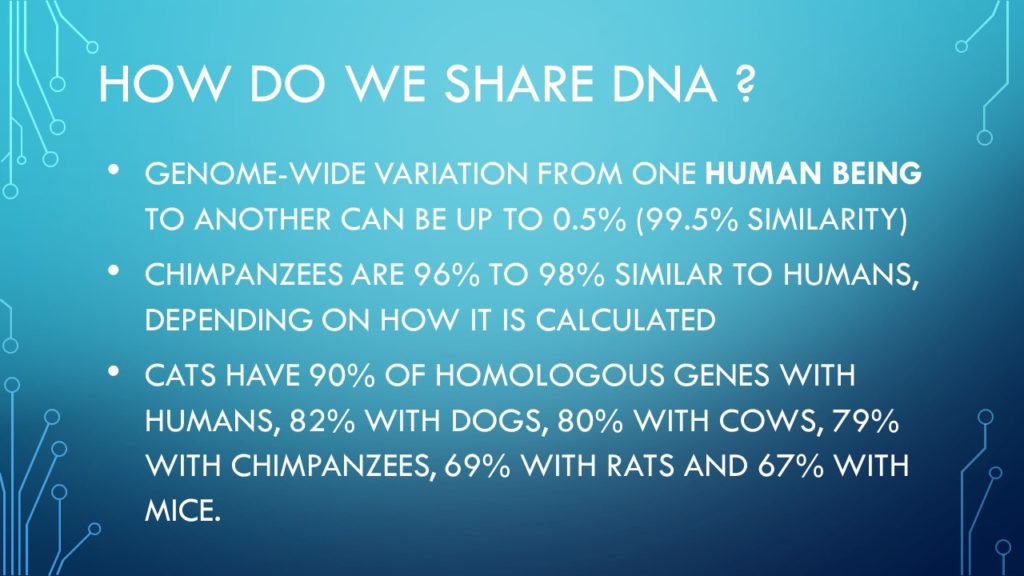
Much of the information in our DNA is the same in other living creatures.
Slide 12
In 1857 Gregor Mendel performed an experiment with plants that led to increased interest in the study of genetics. This eventually led to the study of human genetics.
For more info on the History of Genetic Research go HERE.
DNA is a complex topic. For the purpose of this presentation I will focus on the basics.
We get our DNA from our parents who got it from their parents and so on. Autosomal DNA [which is the focus of this presentation] comes only from the first 22 Chromosomes. We reference the segments in multiple ways. One way is by base pairs. Each Chromosome starts with Base Pair 1 and ends on its last Base Pair. All Chromosomes have a different number of Base Pairs. A smaller part of each Chromosome can be defined by a starting Base Pair number and an ending Base Pair number.
Slide 13
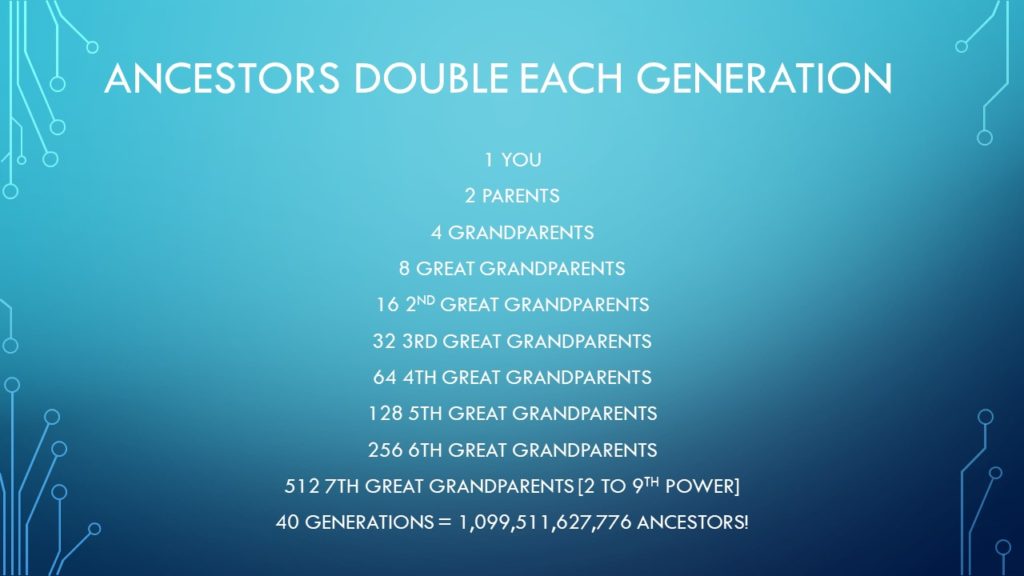
Since everyone has 2 parents and they each have two parents etc. The number of ancestors doubles with each generation.
If you could trace all of your ancestors back 40 generations (roughly to the time of Charlemagne) you would have over a trillion ancestors just for that generation.
This obviously isn’t possible since at the time of Charlemagne because the population of the earth did not reach one billion until they year 1800.
So how is this possible? You have multiple paths to the same ancestors.
[If you don’t know who Charlemagne is click HERE.)
If you are related to him then check out this site HERE.
Slide 14
DNA is a complex subject. For the purposes of autosomal DNA research I will keep it simple.
Slide 15
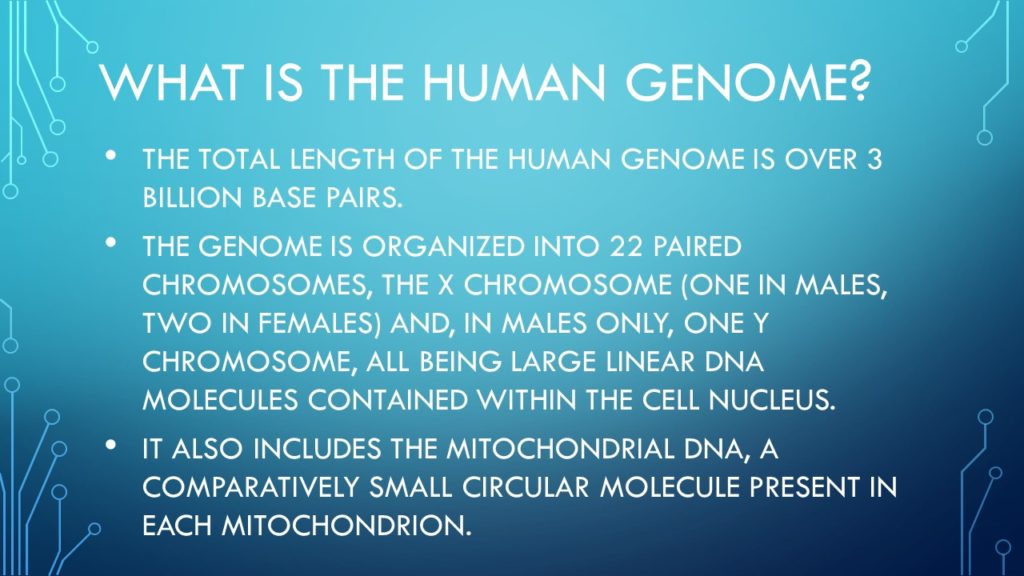
A good video to dive deeper into the Human Genome is located HERE.
Slide 16
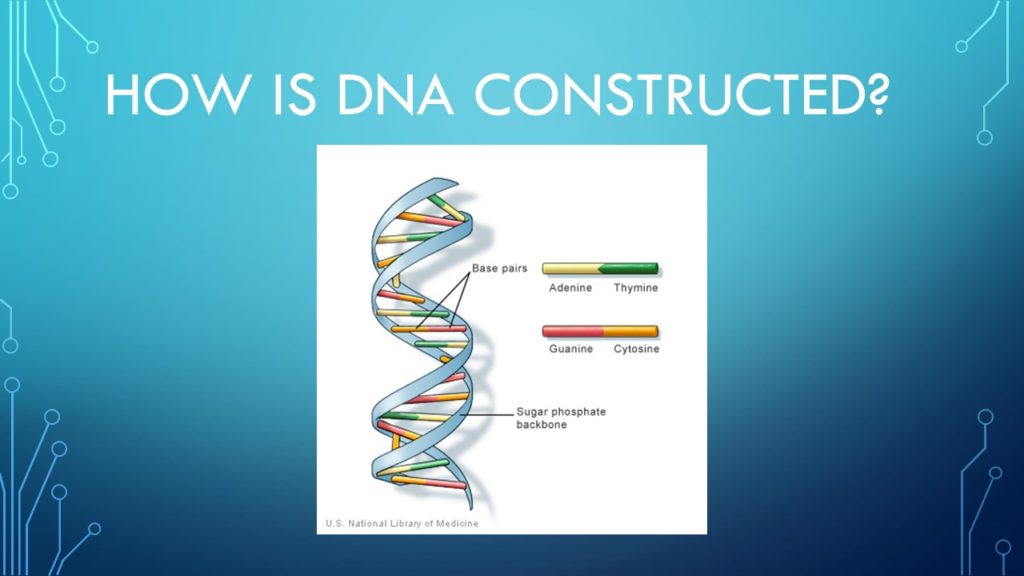
The DNA chain is made up of Base Pairs of combinations of four different Nucleotides.
A more technical presentation is located HERE.
[Aren’t you glad I didn’t go this deep???]
Slide 17
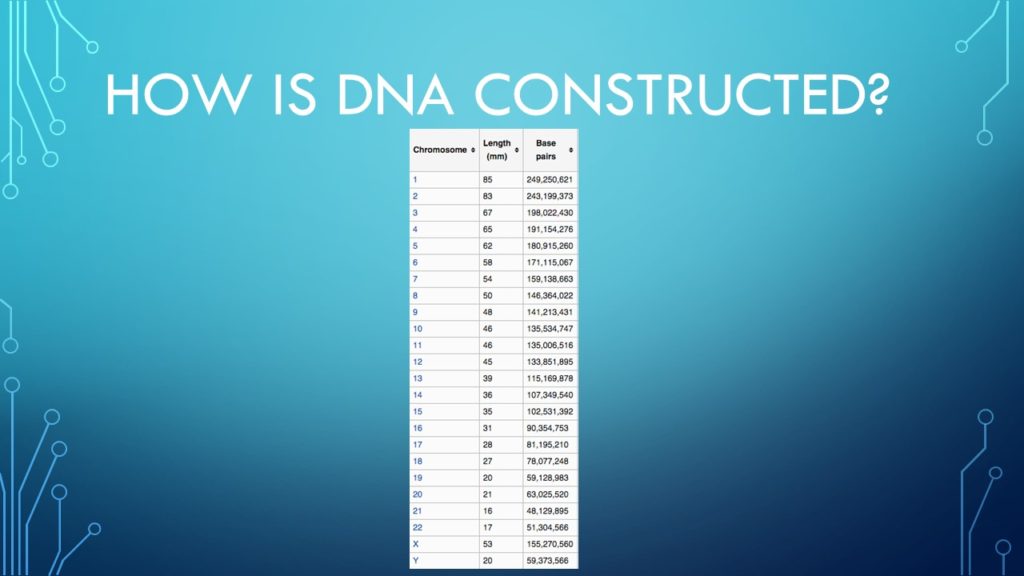
Each Chromosome starts with Base Pair 1 and ends with its last Base Pair. In this slide we can see that each chromosome has a different number of Base Pairs. A portion of that chromosome is referred to as a segment. We can identify it’s location by what chromosome it is on and it’s starting and ending base pair.
For example Chr. 6: Base Pairs 36,284,111 – 79,993,211
This is one way we can refer to a specific segment.
Slide 18

If we would examine our Chromosome 6 we will see that it is composed of a specific number of Base Pairs.
Slide 19

If you take your autosomal DNA test on Ancestry.com you will see others that have also taken the same test. The real value is not knowing that you are related to these individuals. Autosomal DNA does not directly show us how we are related. We can use good genealogy research however to do that.
Slide 20
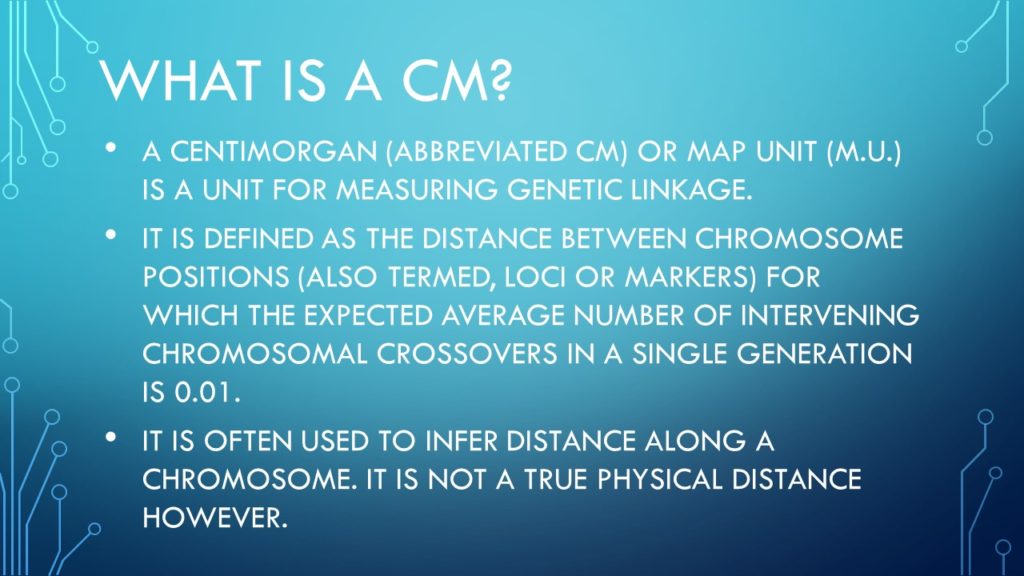
Another way to reference a specific segment is by the chromosome it is on and by its centimorgans.
Slide 21
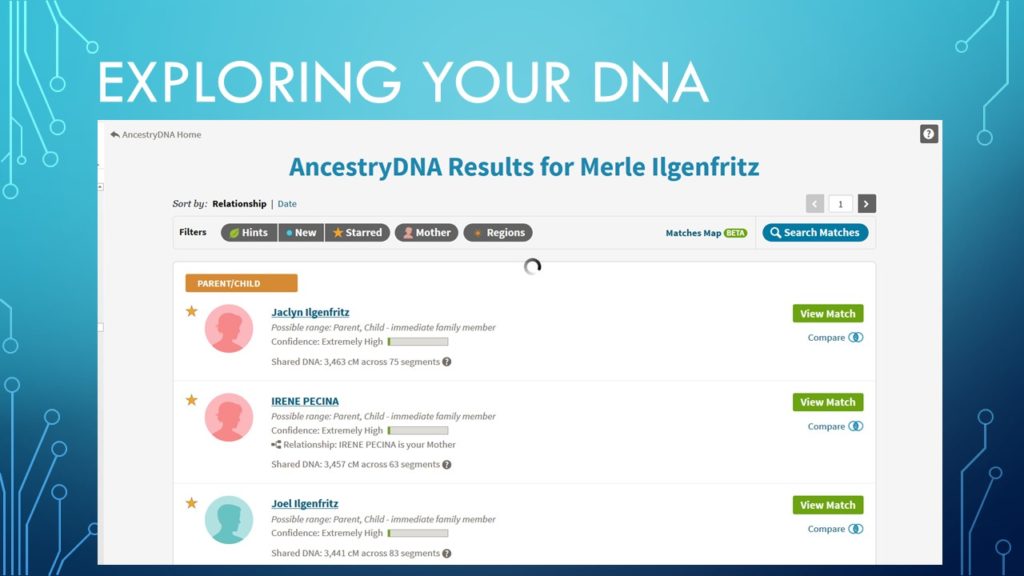
As you can see in this slide the number of common cMs is listed for each relative.
Slide 22
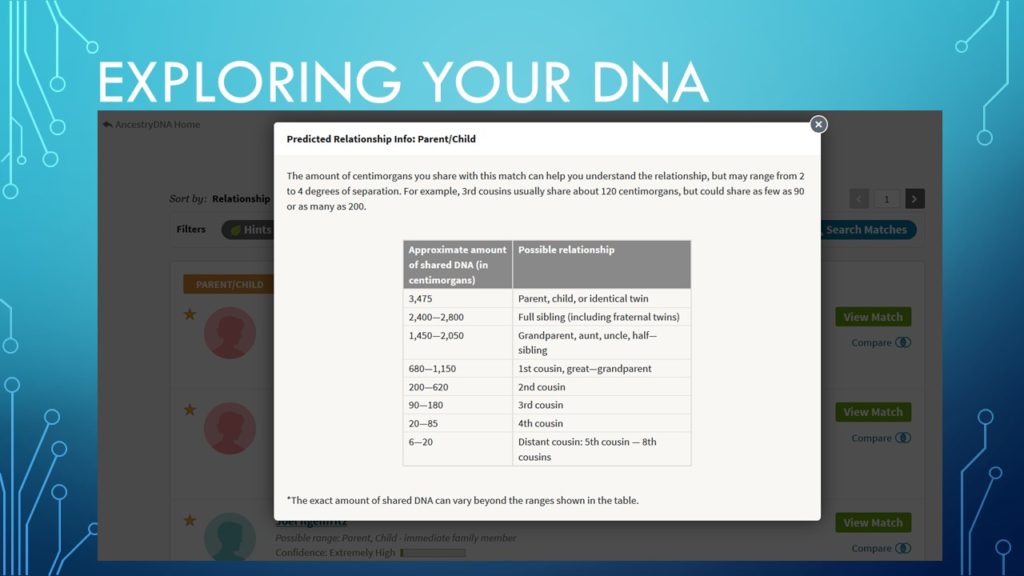
When comparing your autosomal DNA to someone else’s, you might see that the software you are using tells you that you have a certain number of segments in common with that person. Each segment will be a certain number of centimorgans [abbreviated as cM]. The total amount of common DNA can help determine how you are related to that person.
Notice that the top of the chart in this slide that the highest number represents only 3 possibilities: that the person you are comparing DNA with can only be either a parent, child or identical twin. Obviously if that person is older than you they would be your parent, younger than you they would be your child and having the same birthday your identical twin.
As will look lower in the chart we see that the number of cMs gets lower and the relationships get further apart. This chart [and others like it] are a guide to help us approximate how distant the relative is from us. Be aware that you could have 0 cMs in common and still be related. We will understand how that can be possible later in the presentation.
Slide 23
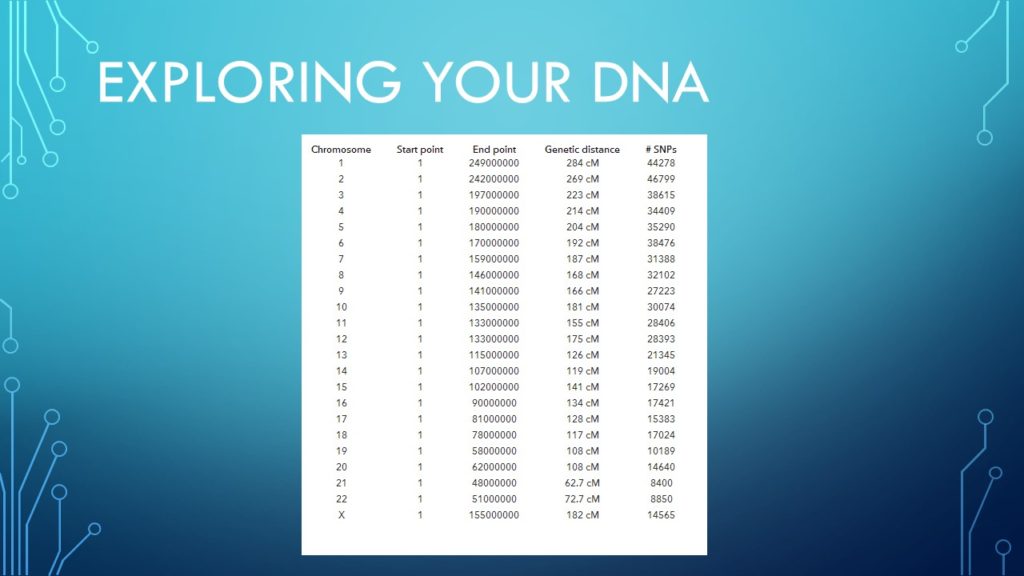
This chart shows the 3 ways we identify segments in autosomal DNA: Base Pairs, cM and SNP’s.
Slide 24
There is a free self paced online course available called: Introduction to Biology – The Secret of Life
To learn more click HERE.
Slide 25

These nucleotides contain genetic information. The sequence of them provides instructions for our cells and how they will grow and work.
Slide 26

This chart shows the 3 ways we identify segments in autosomal DNA: Base Pairs, cM and SNP’s.
Slide 27
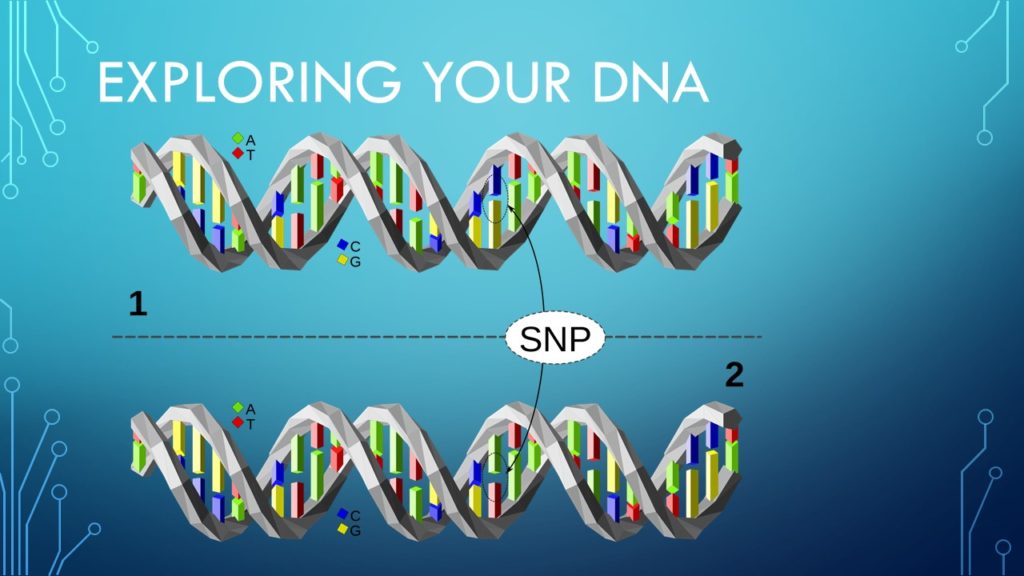
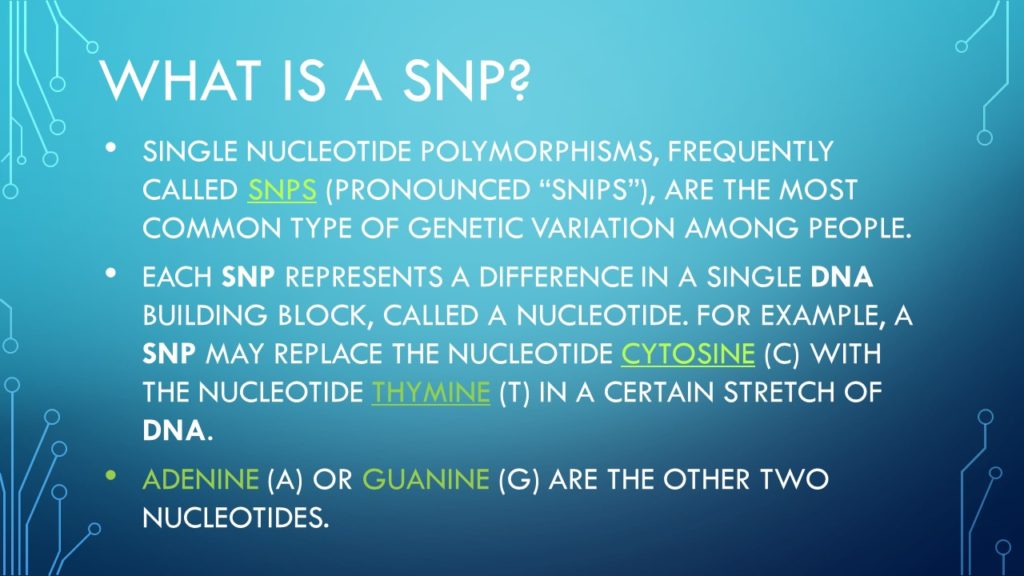
Single nucleotide polymorphisms, frequently called SNPs (pronounced “snips”), are the most common type of genetic variation among people. Each SNP represents a difference in a single DNA building block, called a nucleotide.SNPs cause genetic variation among people.
For more info on SNPs click HERE.
Slide 28

From the previous chart we could summarize Chromosome 6 as a certain number of Base Pairs, SNPs or cMs. The numbers are different per chromosome. Your Chromosome 6 was constructed at the moment of conception using DNA from your parents. The process that does this is called recombination.
Slide 29
Recombination allows for genetic variations from generation to generation.
Slide 30
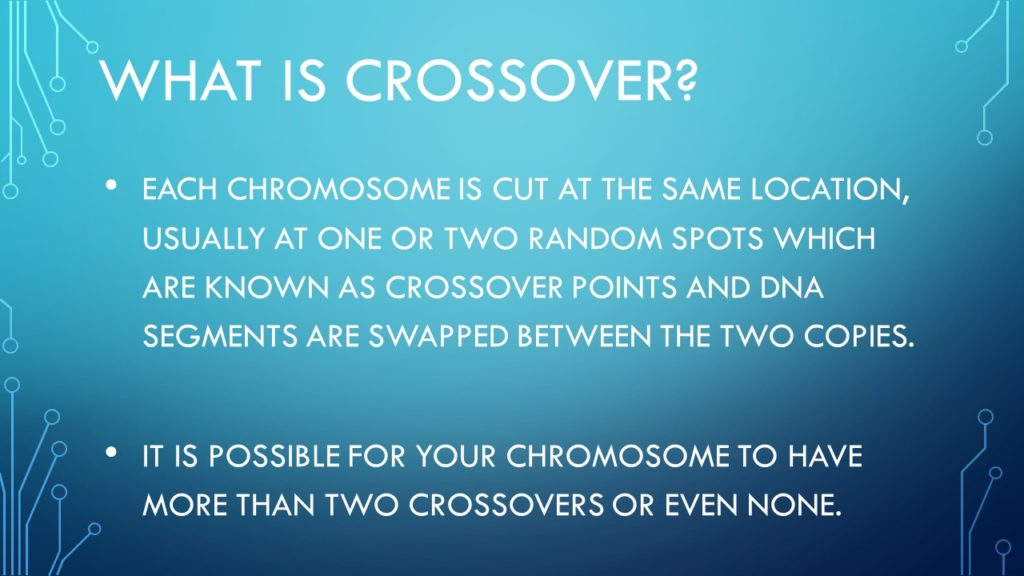
For more info on crossover click HERE.
Slide 31
Autosomal DNA is similar to going fishing with a large net. With a large net you will catch all kinds of fish in it.And you can catch a lot of fish with it.
Autosomal DNA allows you to “catch” relatives from all parts of your family. It also can provide you with THOUSANDS of new relatives.
It is an excellent test to find people that have a common ancestor related to you within the past 5 to maybe up to 7 generations ago.
Autosomal DNA tests the part of your DNA that recombines between parents every generation.
Slide 32
There are many testing companies that off autosomal DNA testing.
Be aware however that will autosomal DNA can tell you that you are RELATED to someone. It won’t tell you how. The greater the number of cMs, the closer you are related to that person.
You must use traditional genealogy to help you determine HOW you are related to the relative.
Also remember that it is possible that you share no common autosomal DNA with someone and yet you are related to them. This is caused by recombination. With each generation we lose genetic information from ancestors.
Slide 33

So lets review how your DNA came from your ancestors!
Slide 34
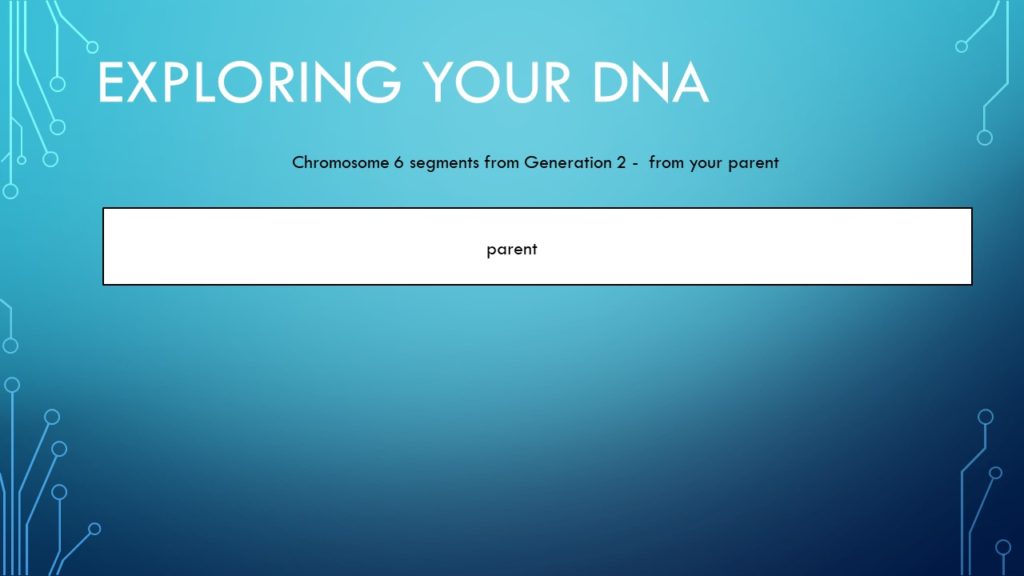
So let’s look at one of your parents Chromosome 6.
Slide 35
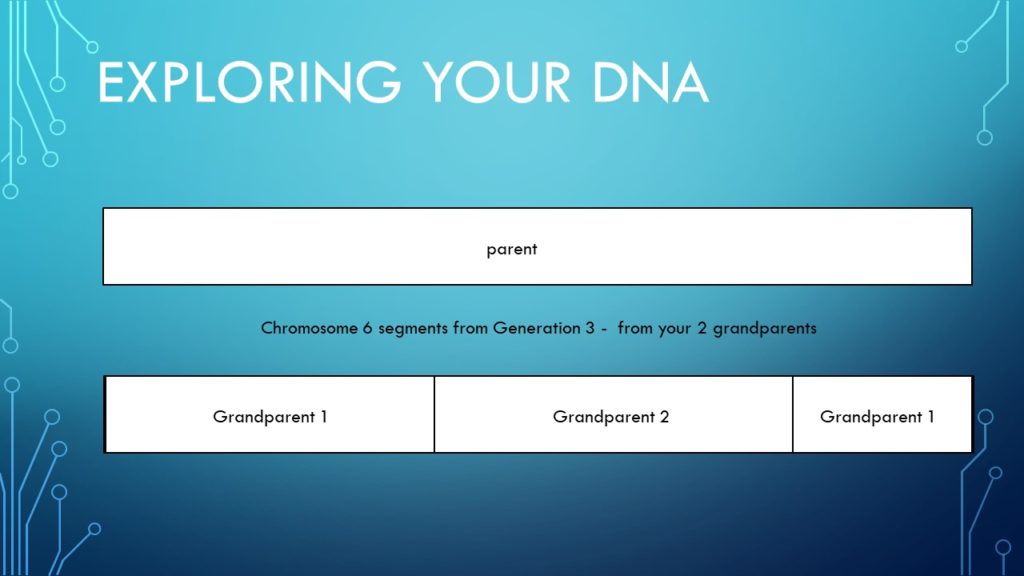
Your parent got their Chromosome 6 from their parents. Let’s say this is your mother’s Chromosome 6.
This slide shows that the first segment came from their father, the second segment from her mother and the third segment from her father.
The line between them represents a crossover point. Each segment can be defined by a starting and ending Base Pair. Each segment also can be defined by a certain number or cMs or SNPs.
Slide 36
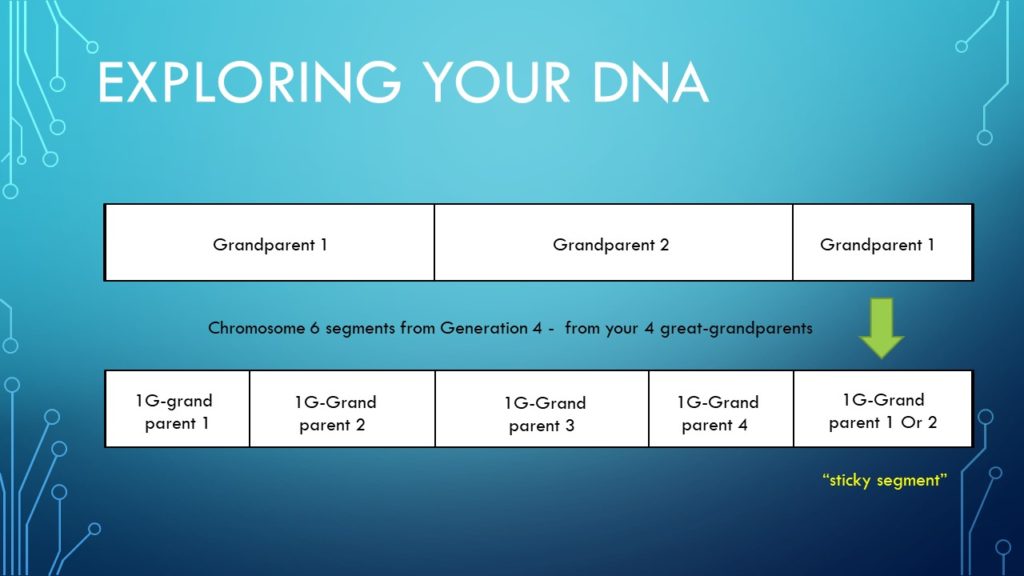
Looking back another generation we could see that your mother’s first segment from her father [referenced as your Grandparent 1 – which would be your mother’s dad] got his DNA for that segment from his parents.
Sticky segments are segments that pass from generation to generation without change.
To learn more about them click HERE.
Slide 37

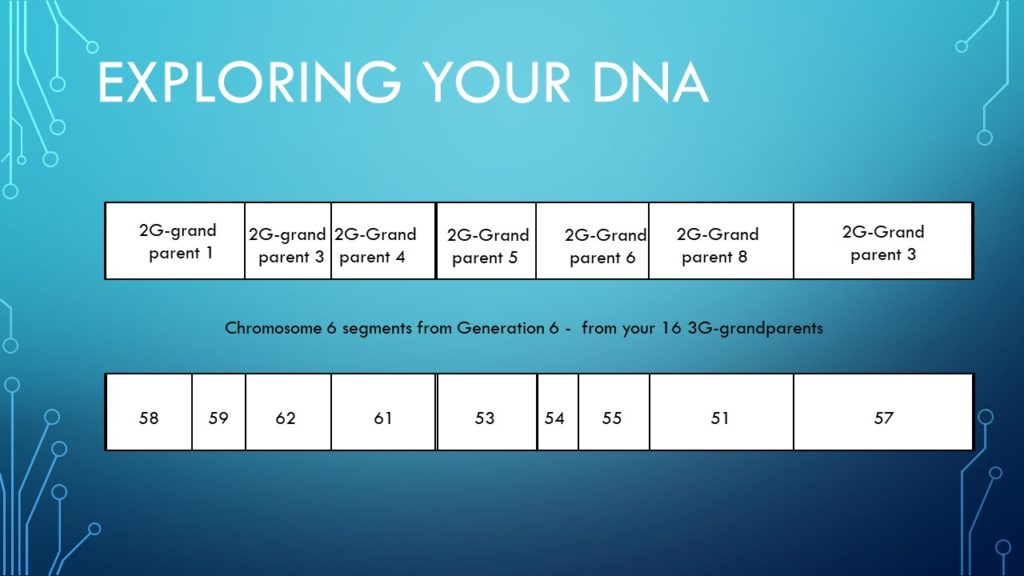
If we were able to determine which of your ancestors contributed their Base Pairs to you, as we went further back we would see which segments came from each ancestor.
Slide 38
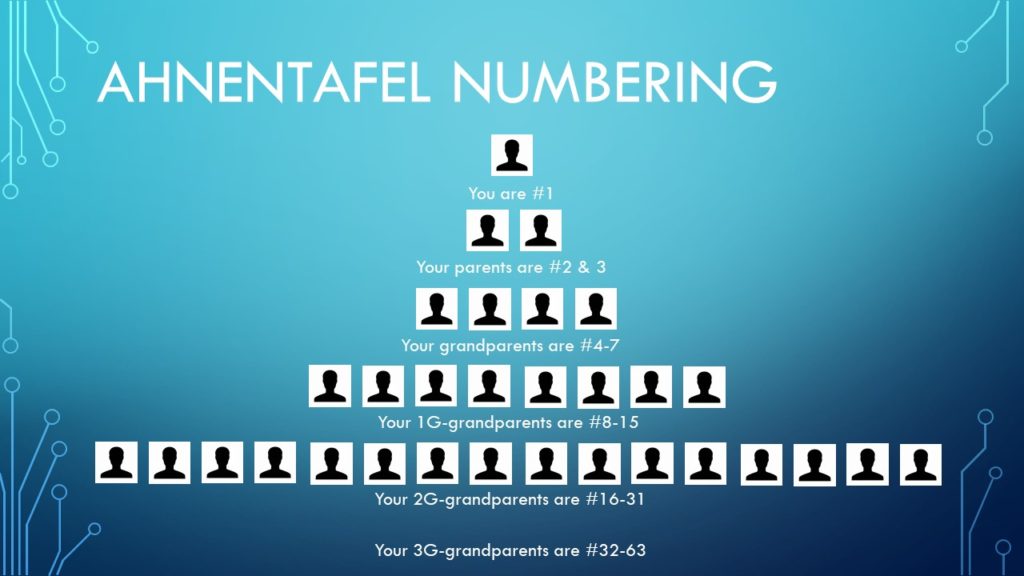
Genealogists use a numbering system that always numbers you as #1, your father as #2 [all male ancestors have even numbers], your mother as #3 and so on. This is useful in tracking your ancestors.
To learn more about this numbering system click HERE.
HERE is a free numbering chart.
Slide 39
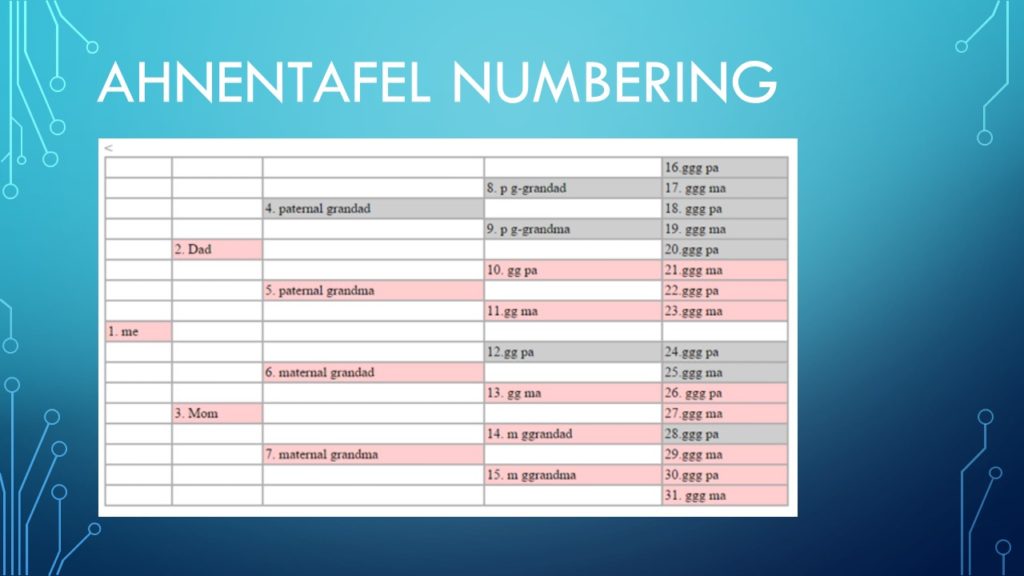
When using autosomal DNA we are trying to figure out how we connect with our relative by identifying the MRCA (most recent common ancestor). Keeping a chart listing all of your ancestors is helpful to see the various ancestor surnames in your tree.
Slide 40
As you can see the previous crossover point boundaries carry to the next generation because the previous generations segments provide the DNA for the next generation.
Notice that over time the contributed DNA from ancestors is lost due to recombination. That explains why autosomal DNA can only go back so far. However there are other tests that can help with deeper more distant searches. I will cover them in later presentations.
Slide 41

On the Ancestry website once you have received your DNA results you will then be alerted that you have new relatives. They will be listed with the person that has the most shared DNA with you.
Slide 42
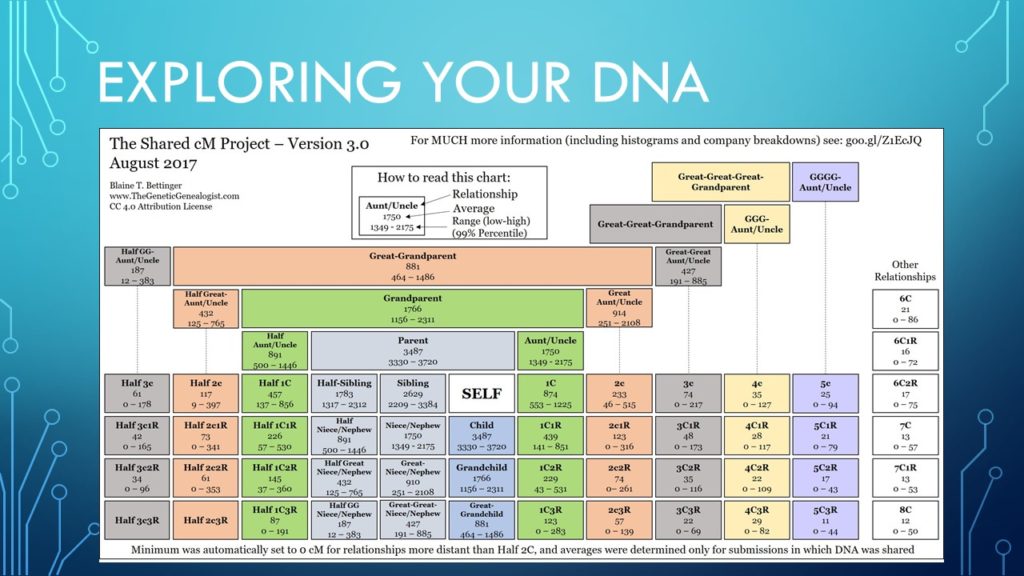
This chart helps us determine what possible relationships we could have with a person. Let’s say you have a relative that you have 215 cMs in common. This chart shows that you could be a number of possible relationships based on that number. We can use that information to help us determine how many generations ago our MRCA lived. Notice that even with 0 common cMs you could still be related a number of different ways. These numbers are based on observed numbers of known relatives. The first number is the average for that type of relationship.
Slide 43
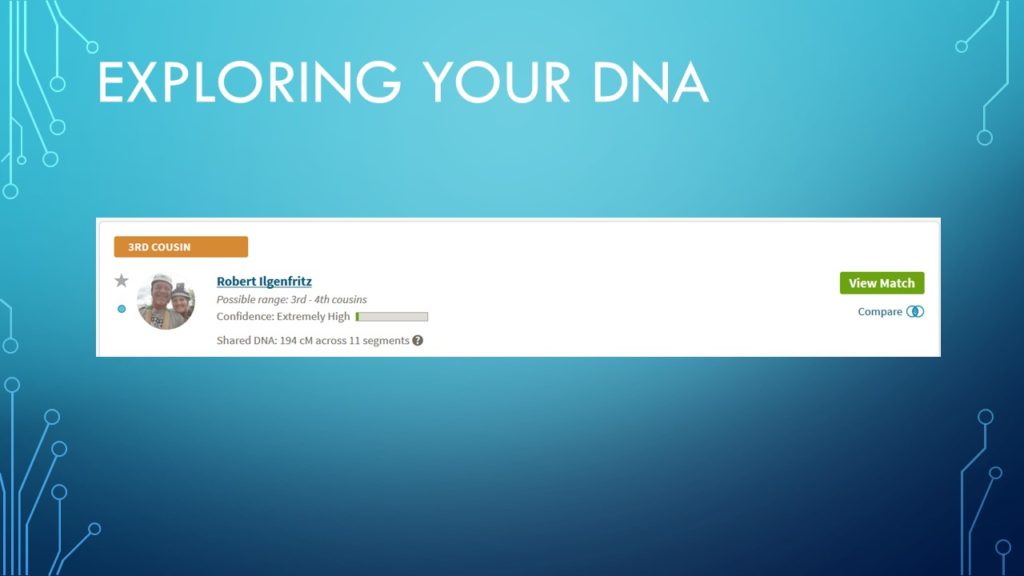
Ancestry is showing Robert “Bobby” Ilgenfritz as my 3rd cousin. In reality we are second cousins. So don’t be surprised if some relationships are different. [FYI – using the same RAW DNA data on the genesis.gedmatch.com site we show as having 215 cMs in common. So a lot depends on how the DNA results are interpreted by the testing companies.] If you click on the Compare link you will be taken to a page that shows your Shared Matches.
Slide 44
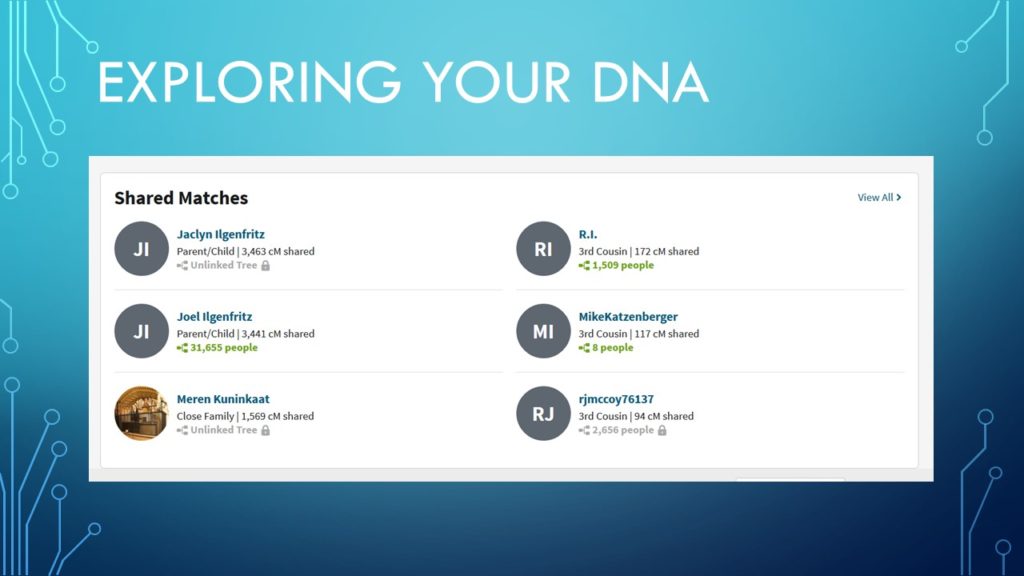
From her you might want to investigate each person, contact them if you don’t know who they are and share information with them about your common ancestors. I have received MANY awesome pieces of information and previously unseen pictures from my new relatives. The power to all of this is in the SHARING. If you come across someone who is unwilling to share then you should beware.
Slide 45
When three people have the same DNA segment and the same ancestor then you have autosomal triangulation.
When you triangulate you first determine what is the MCRA for all of the people that share that segment. Then you identify their child that you are related to.
For instance: if you and 2 cousins all share your great grandparents as common ancestors then you can not be sure which of your great grandparents the segment came from. But you do know in order for you to get that segment that your grandparent who was their child passed the segment to your parent and then to you.
Slide 46
A triangulation group has members who might not all have common segments but triangulate with at least two other people in the group and all members share the same common ancestor.
Ancestry groups all of these people in a “DNA Circle”.
Slide 47
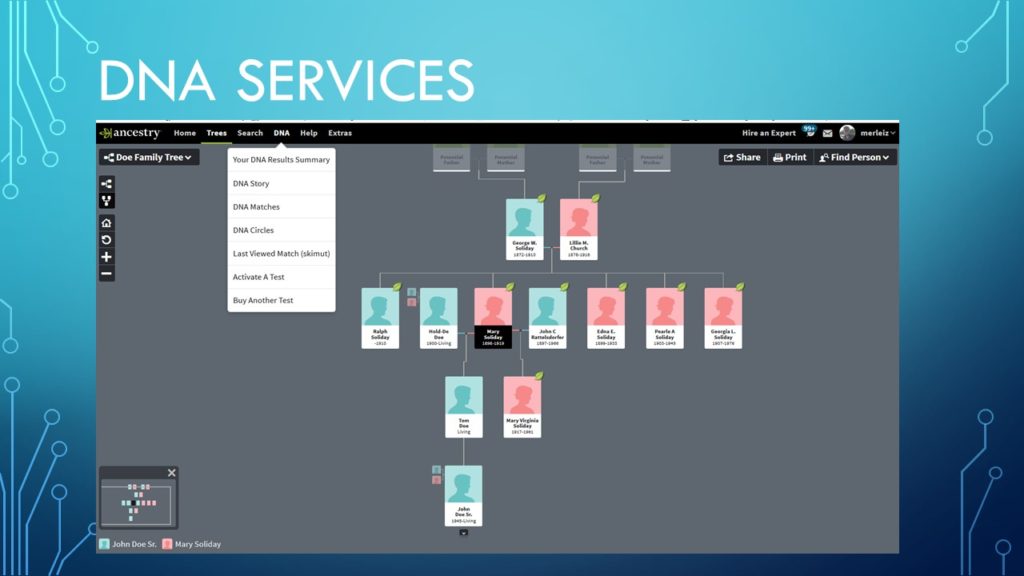
To explore DNA Circles in Ancestry, click on the DNA tab and select the DNA Circles option in the drop down menu.
Slide 48
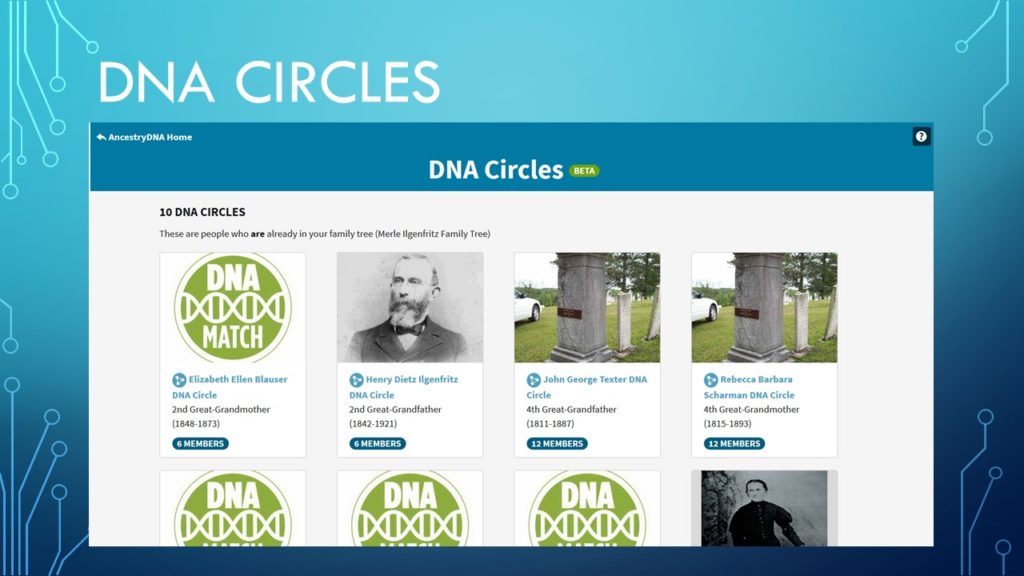
DNA Circles do not appear unless you do the following things:
- You have to obviously have your DNA results from Ancestry.
- You have built a family tree on ancestry. If you have just you, your parents and grandparents you probably won’t see any Circles. The closest relatives I have in my DNA Circles are 2nd great grandparents. So you need to work on your tree and go further back.
- You must have a matching segment with at least two other people and have the common ancestor in all three trees.
- Wait. It took over 6 weeks before I started to see circles. I have over 33,000 people in my tree. So it is not always you that are preventing circles to appear.
Slide 49
DNA Circles can extend the benefits of autosomal triangulation to introduce you to relatives that share a common ancestor with you but you might not share any common DNA from that ancestor. This new relative might have info on an ancestor that no one else has.
Slide 50
I will cover this topic in the fourth presentation. y DNA testing is useful to confirm father to son relationships since the y DNA is virtually unchanged from generation to generation.
Slide 51
Females can not take this test. But the results can firm up paternal lines. It only works for your birth surname. So you can’t help people working on other branches of your tree.
Slide 52
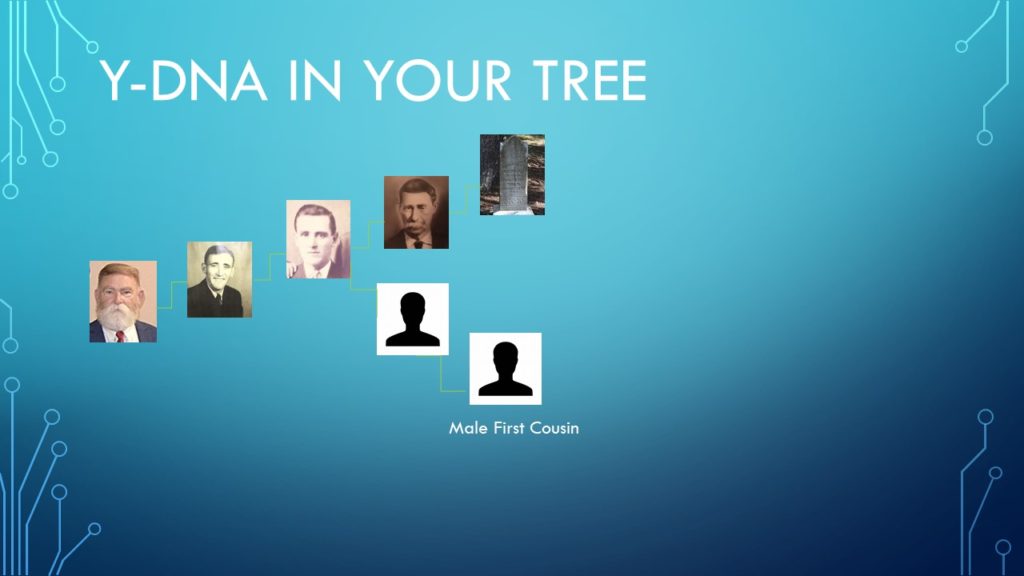
For men taking this test, first try to get a male first cousin to take it. This confirms your common grandfather.
Slide 53
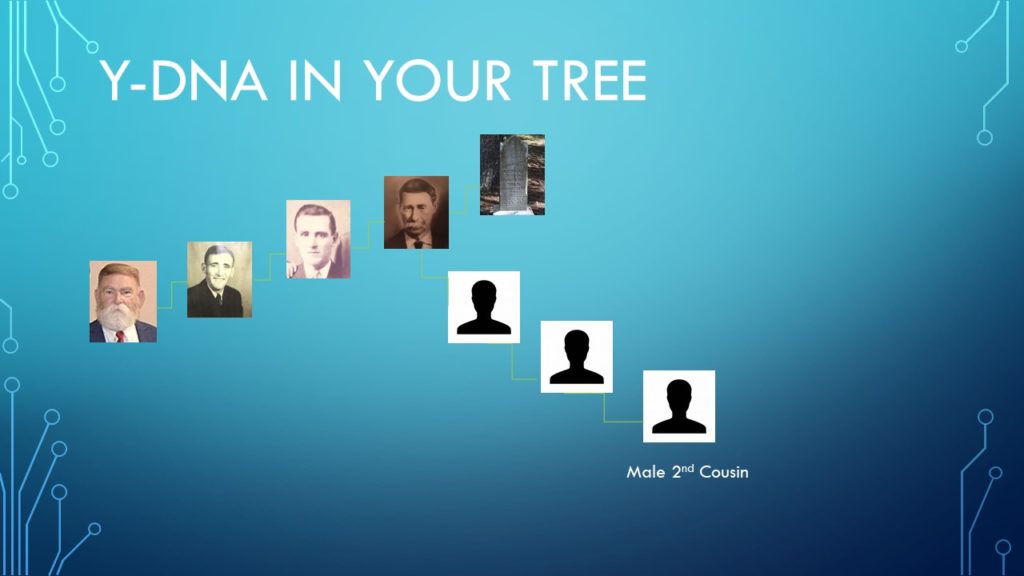
Then try to get a male second cousin to take it. Having multiple 2nd cousins if there were multiple brothers for your grandfather is best.
Slide 54
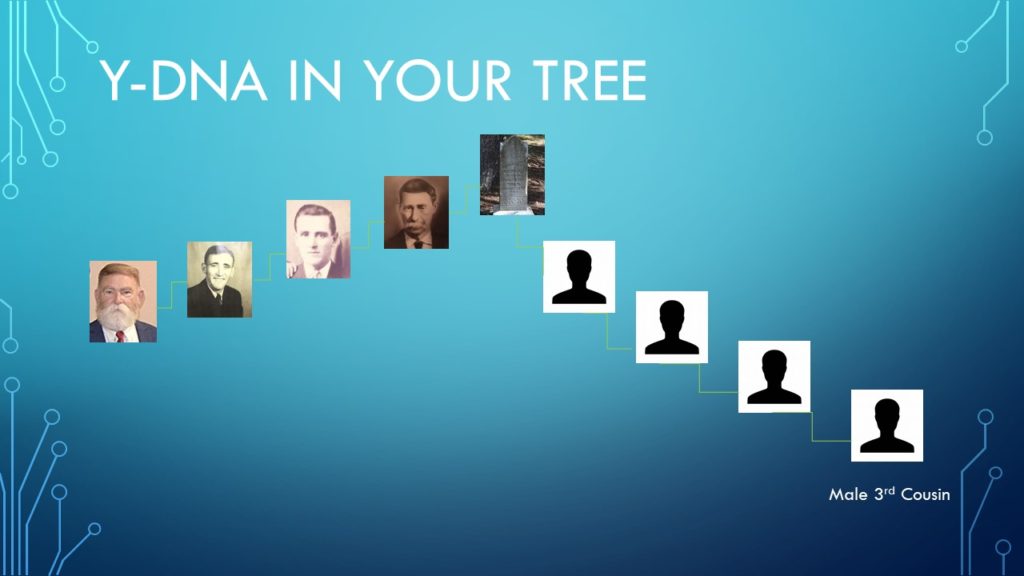
As you get more distant cousins tested you can confirm each generation of male ancestors.
Slide 55
There are a number of y DNA testing companies. Y-DNA tests a specific set of Y-chromosome Short Tandem Repeat (STR) markers. The number of markers tested by most DNA testing companies can range from a minimum of 12 to as many as 111. The more markers you test for the higher the cost but the advantage is that the higher marker tests can further refine the estimate of how closely related two individuals are.
By using additional markers groups of related participants you will have a better chance of finding mutations which identify sub-branches in the family.
BUT!
Everyone else would have to test at that level to get the maximum benefit. [You still can compare to someone with less markers but the results will be less accurate].
For more info on the advantages of more markers click HERE.
Slide 56
The main reason why you get few responses from relatives with matching DNA is that they were more interested in learning what their ethnicity is than who their actual ancestors are.
Also when they discovered they would have to do research to find out they quit caring about it.
Slide 57
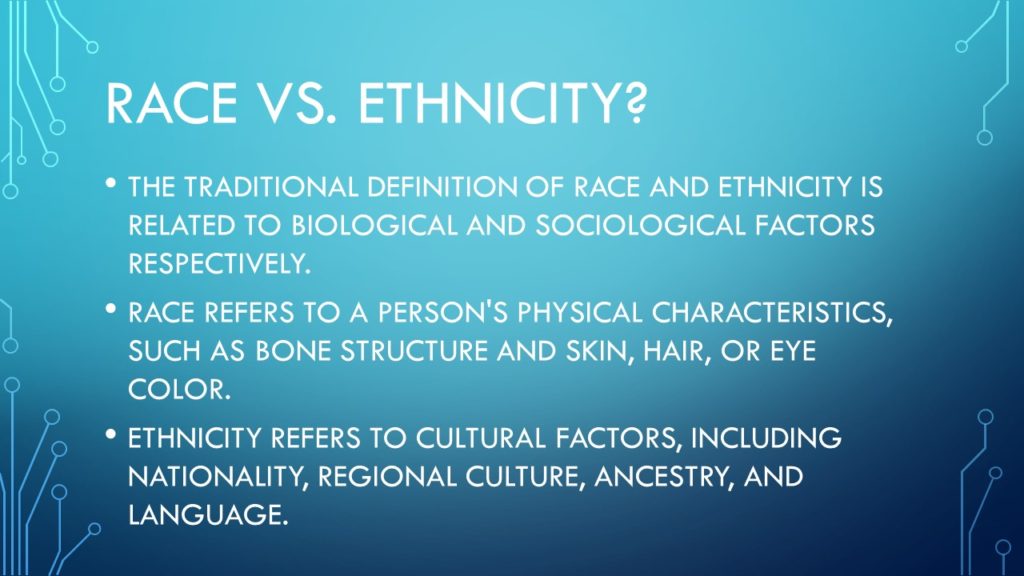
I present these slides only to address the DNA ethnicity issue. I personally don’t believe the “science” is there to accurately tell us what our ethnicity really is. I won’t debate with anyone on this topic because for me it is a waste of time. However Ancestry does provide some useful information on their site that they have positioned to do with ethnicity. I feel those things are useful.
Slide 58
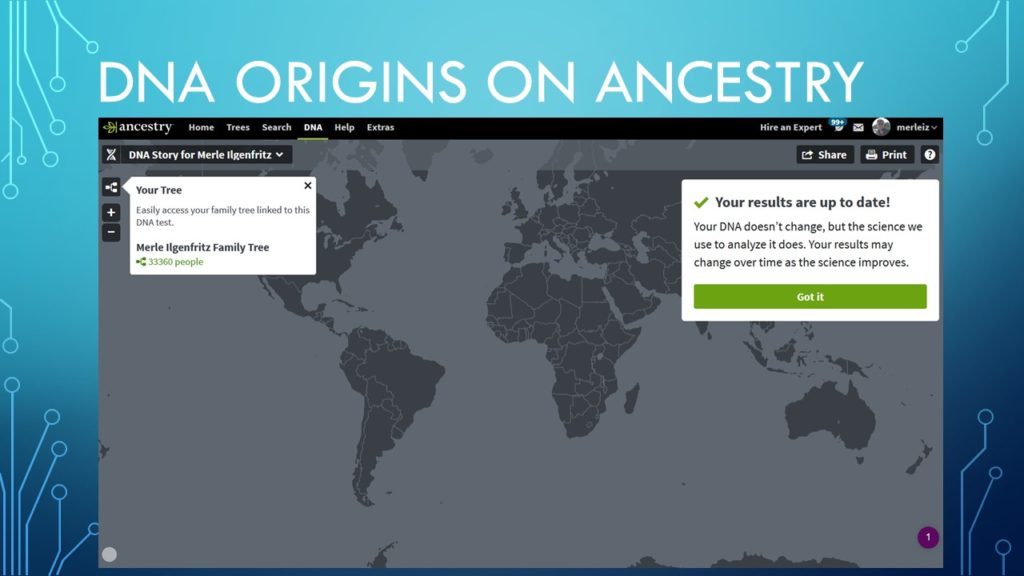
If you click on the DNA tab and select DNA Story you will come to this page. Click on the Got it button to see their estimates.
Slide 59
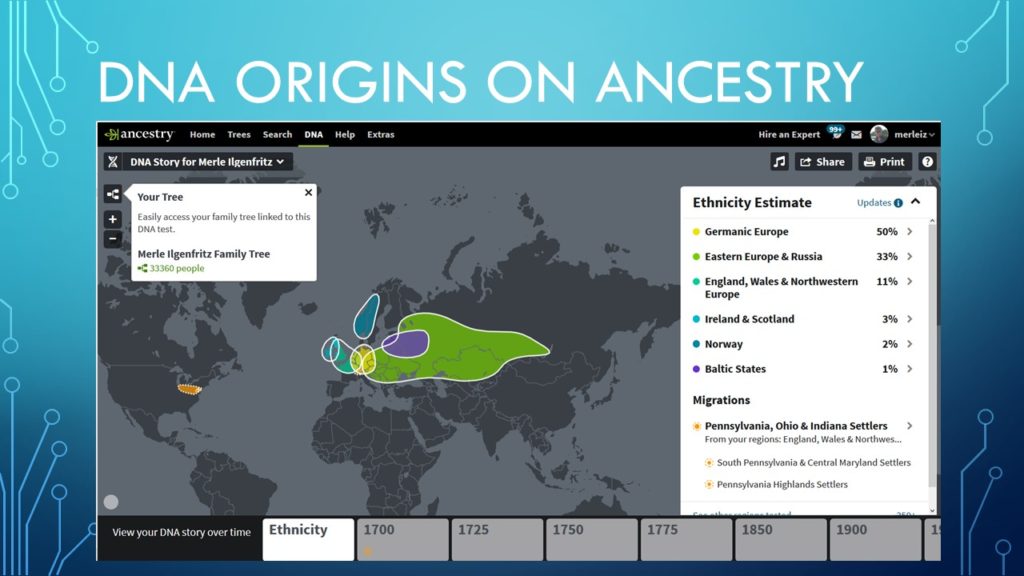
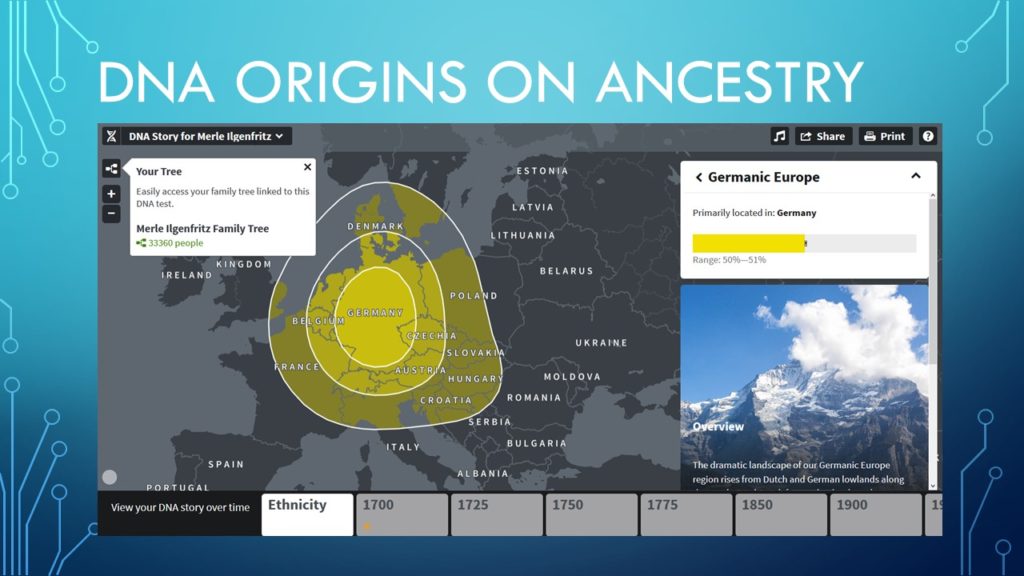
In September 2018 Ancestry updated its ethnicity calculations. My first concern is how different their first “estimate” was compared to the second one. Many people feel their “identity” is tied to who they think they are. Since these are just estimates we shouldn’t consider them as facts. But many people do. If you were to ask me what percentage I would think my German heritage is I would guess based on my research that is was close to 65-70%. As you can see Ancestry says it is 50%.
Slide 60
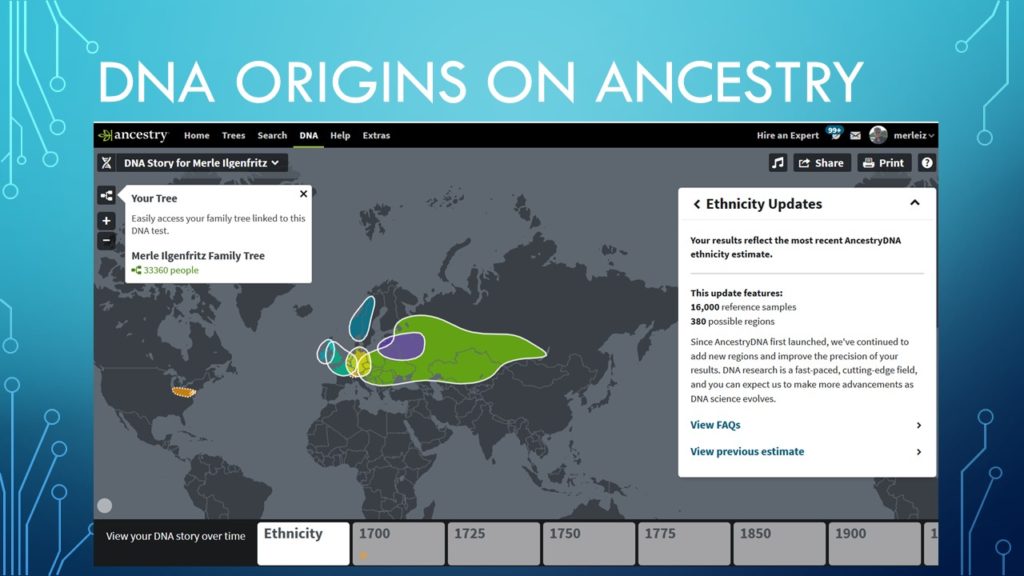
If you click on the ? on the top right you will see more info concerning this estimate. Click on the View FAQs link to learn more about it.
Slide 61
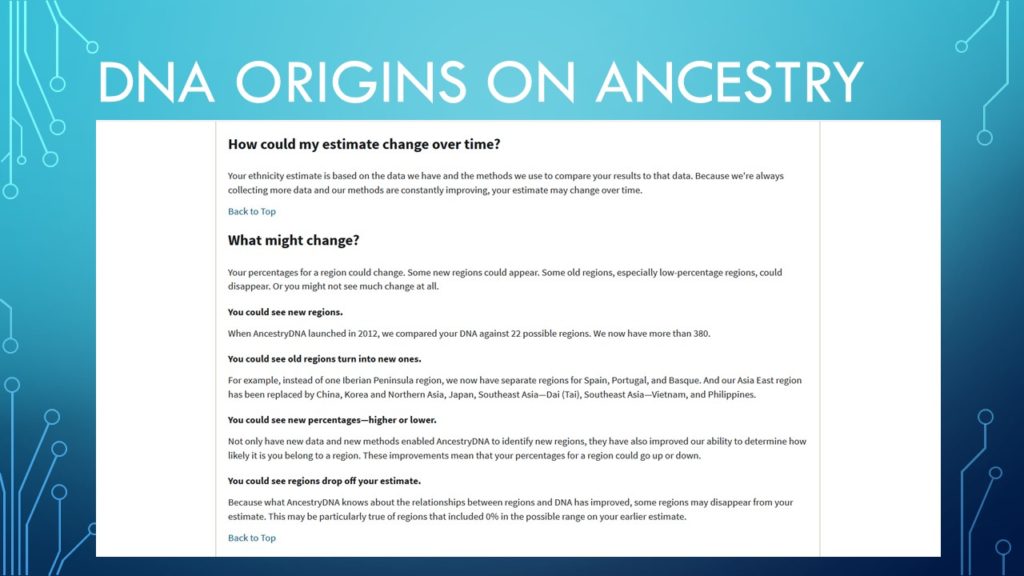
This is the FAQ for this estimate. You might want to read through it to get a better understanding as to how they come up with the percentages.
Slide 62
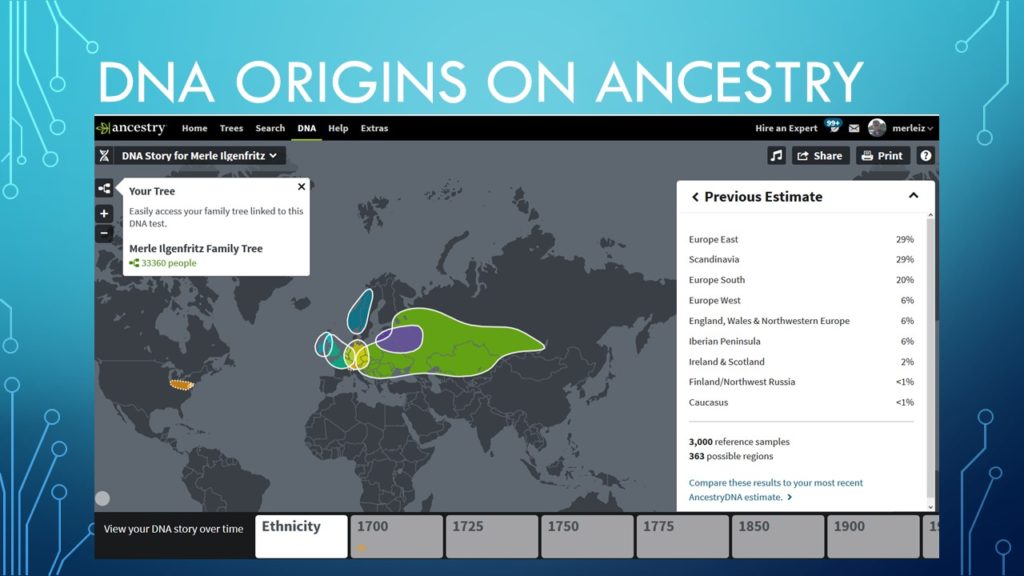
You can also see the previous estimate. Europe West represents Germany and some surrounding areas. I was only 6% on this estimate. So I will wait on this aspect of DNA research. The science is not stable enough for me to give it much thought.
But if you want to dive deeper into it then knock yourselves out! 🙂
Slide 63
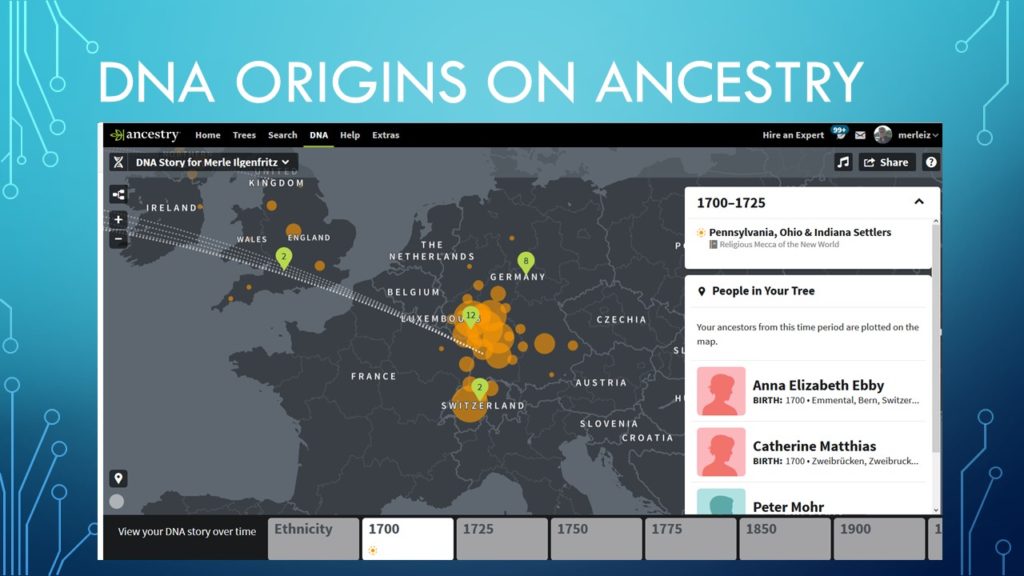
One useful feature is the maps feature. This shows people from your tree that you have identified where they were from and allows you to pick a time frame to see those ancestors.
Slide 64
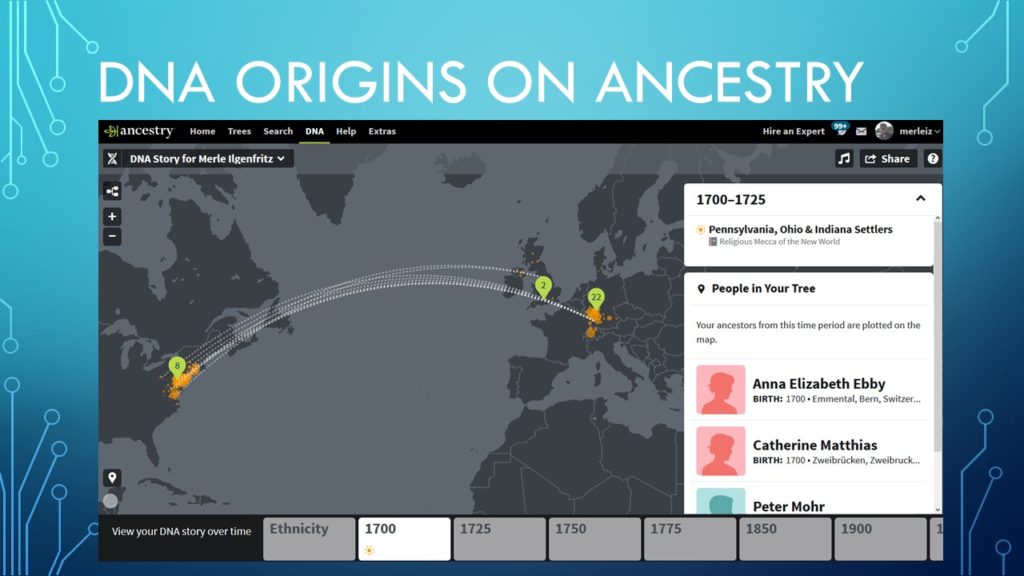
I find this useful [it has nothing to do with ethnicity] but does visually show us when and where our ancestors immigrated from.
Slide 65
You can click on the plus (+) symbol on the top left to zoom in on the map.
Slide 66
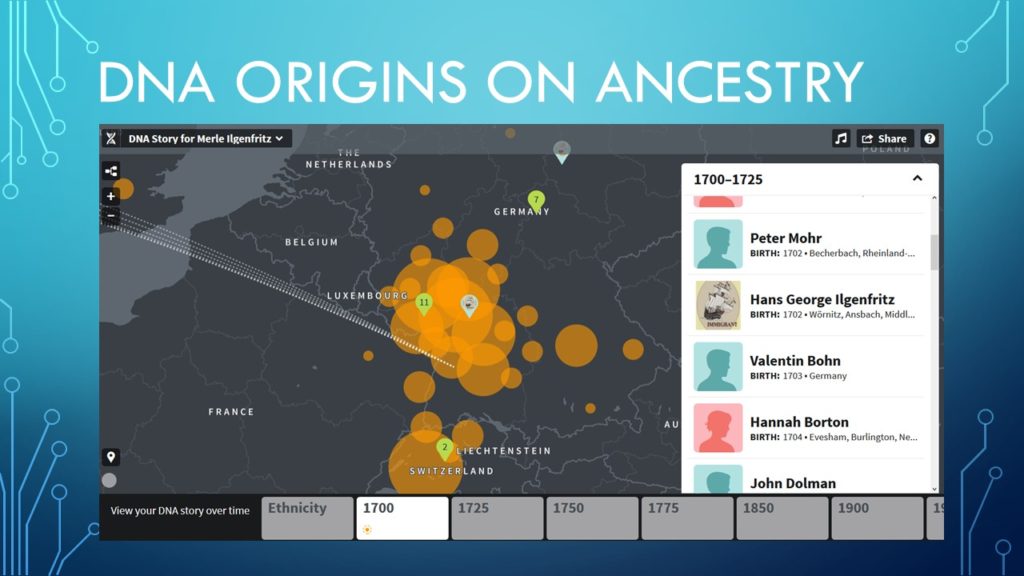
I find this useful to understand where certain ancestors lived in relation to each other.
Slide 67
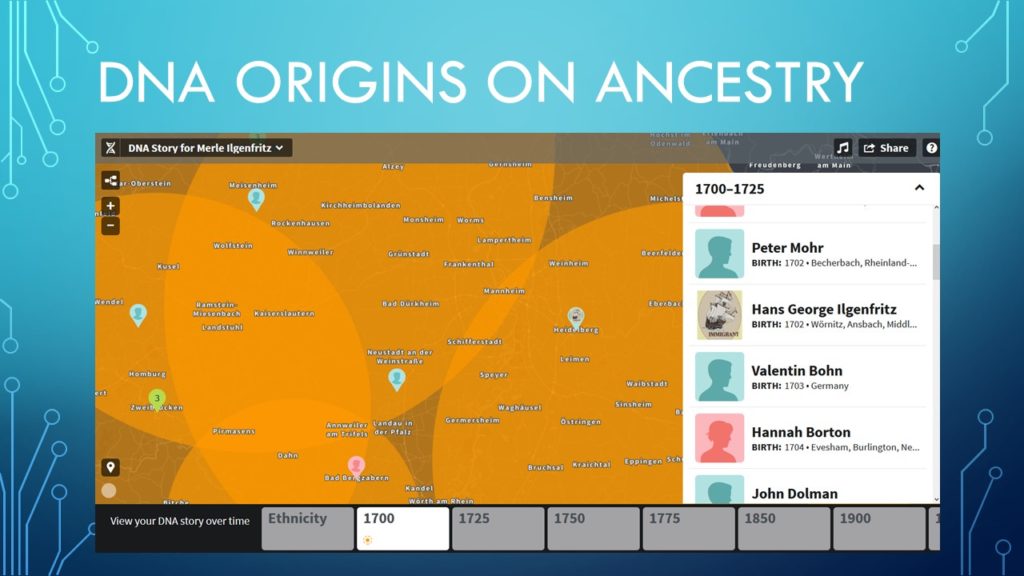
If you zoom in enough you will see town names and the ancestor names. Great feature!
{I didn’t need an ethnicity report to tell me they are all German…just saying]
Slide 68
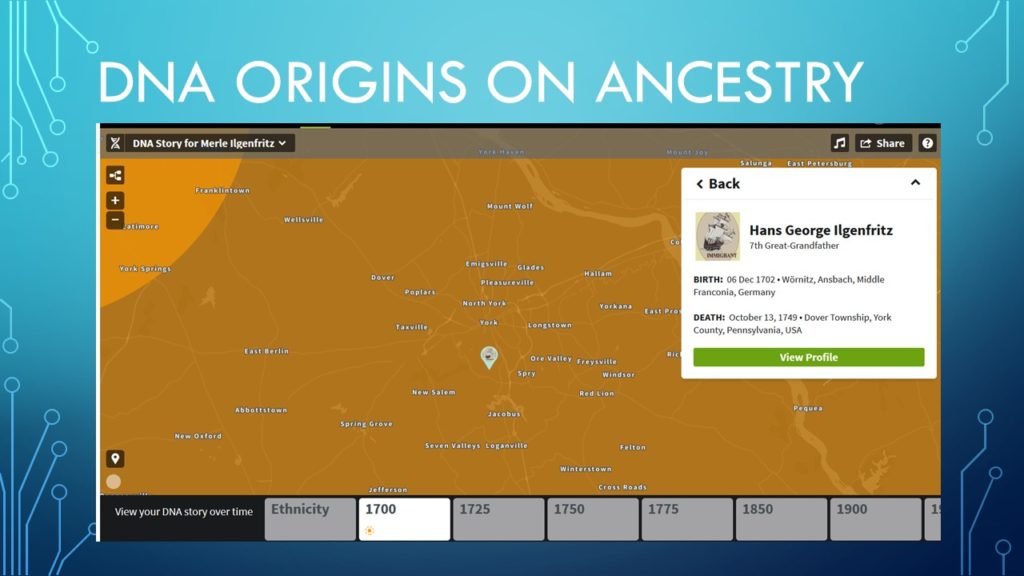
If you click on a specific person on the map then you will see them on the right. ALL of the info you will see is the result of your genealogical research NOT your DNA results. So the more info you have in the tree then the more robust the info will be here.
Slide 69
This concludes this presentation. I have only scratched the service in this presentation. Hopefully this demystifies autosomal DNA and gets you interested in taking the test.
If you have any questions or comments – please email me at: merleiz@yahoo.com
Slide 70
The next presentation will focus on autosomal triangulation.
The direct link to that presentation is HERE.
Slide 71
Link to other presentations HERE
Slide 72